MTT graph

S

smashthemafia69

Rising Star
Bronze Level
Joined
Aug 29, 2025
Total posts
12
IE
Chips
40
Hello, I am writing this because I am tired of the abuse I have been experiencing. I have been gritting my teeth for years already and I hope this is just variance and that I have drawn the short straw, starting with bad luck. I have invested too much time and energy into this game. Years of learning, GTO, watching streams, dozens of hours of coaching, hand reviews, etc. Anyone who has seriously started this knows what I am talking about. The problem is that I have no luck, literally as if the game is kicking me out by a script at every important moment. I will upload my graph and ask someone to give me advice if they know how I can check whether what is happening to me is variance or a mathematical anomaly. I am sure I am far above the field of players at the limits I play, and I am just tired of the unfairness. Please help! The graph is from MTT pokerstars.
 

Attachments

  • pppp.png
    pppp.png
    32.9 KB · Views: 67
primrose

primrose

Visionary
Bronze Level
Joined
Mar 29, 2024
Total posts
645
Chips
374
I don't see how anyone could say something useful just based on your graph. But also, the graph doesn't tell us which color is which stat. And I'm not sure what Showdown and Non-showdown even means; just all hands that did or didn't end in a showdown?

(And also, doesn't the stat on the left say you're winning?)
 
S

smashthemafia69

Rising Star
Bronze Level
Joined
Aug 29, 2025
Total posts
12
IE
Chips
40
Hi, thanks for you answer!

Blue showdown
Yellow all in abj
Green net won
Red non showdown
Please, can someone tell me if there is a way to analyze for anomalies? I am sure that the results will not come out clean!
 
MK_

MK_

Legend
Loyaler
Joined
Sep 14, 2022
Total posts
2,483
Chips
1,270
Well really hard to make heads or tails of this, your vpip is high at 30%.....,

these stats tell us your results, maybe a little about playing style.....,

not sure what else you're looking for with these stats, maybe post some hands to get more insight👍
 
Marshmalo1994

Marshmalo1994

Legend
Loyaler
Joined
Sep 17, 2022
Total posts
2,625
Awards
1
AR
Chips
1,284
Hello, I am writing this because I am tired of the abuse I have been experiencing. I have been gritting my teeth for years already and I hope this is just variance and that I have drawn the short straw, starting with bad luck. I have invested too much time and energy into this game. Years of learning, GTO, watching streams, dozens of hours of coaching, hand reviews, etc. Anyone who has seriously started this knows what I am talking about. The problem is that I have no luck, literally as if the game is kicking me out by a script at every important moment. I will upload my graph and ask someone to give me advice if they know how I can check whether what is happening to me is variance or a mathematical anomaly. I am sure I am far above the field of players at the limits I play, and I am just tired of the unfairness. Please help! The graph is from MTT pokerstars.
Hi! Sorry to hear that, I'm also not having a good time lately.
I'd like to know what limits do you play.
 
S

smashthemafia69

Rising Star
Bronze Level
Joined
Aug 29, 2025
Total posts
12
IE
Chips
40
Guys, thanks for showing interest in helping me. But I don’t need that right now let’s look at another poker hand
I need to understand why I’m running 5 million chips below EV over 180k hands, and whether this is normal. Do other players go through such a period as well? Is there a way to check for mathematical anomalies?
At the moment, I’m trying to do it with Python, but it feels very complicated for me. Can someone please help me figure out how I can analyze my hand history for mathematical anomalies?
 
primrose

primrose

Visionary
Bronze Level
Joined
Mar 29, 2024
Total posts
645
Chips
374
Okay, now I see what you're getting at.

You didn't provide enough information to answer your question though. Because the variance (which is what determines how unlucky it is to run this badly) depends on the size of the hands you play. Consider two extremes:
  • you only play 18player tournaments that never go above 10x the starting stack. Then this result would be unfathomably unlucky (probably < 0.1%).
  • you play 10000 player tournaments, and you only got really deep twice. Most of the discrepancy between all-in adjusted and real winnings is due to a dozen hands at the end those two huge tournaments (which were for an incredibly large amount of chips). Now, this would probably be pretty normal variance (maybe ~15% likely). You'd still be running badly "across 180k hands", but this figure is misleading because a small number of hands contributed most of it.
If I'm looking at this graph, it seems like there are clearly visible spikes, so I'm assuming the second is closer to the truth. If I'm going to make a blind guess based on basically no information that you shouldn't take seirously, I'd guess maybe bottom 10% luck, but not bottom 1%.

In any case, posting this question in this forum is a pretty odd choice because there aren't a lot of math-savvy people here. And I just know enough about how this works to know that your question is under-specified (as I explained). You mentioned python, but idk what you're trying to do with it.

I'd try your luck in the PokerTracker support forums. Also, Poker Tracker itself may actually have an in-built function to estimate how badly you've been running. They definitely have it for flush draws and straight draws.

BTW, another thing that interests me is why the hands you didn't get to showdown with look this much worse. It's a really extreme discrepancy. Is this normal? It might indicate some leak, like that you're not bluffing enough, or overfold to aggression.
 
S

smashthemafia69

Rising Star
Bronze Level
Joined
Aug 29, 2025
Total posts
12
IE
Chips
40
Yes, of course. I want to fix this problem. I’m not directly blaming the poker site for my bad luck, although my brain can’t find another explanation. I’ve taken this seriously and I will get to the answer. Maybe the problem is in me, although it’s clear that in the last 30k hands my non-showdown line has started to move up. Maybe there really are algorithms that are stealing the time I’ve invested into trying to generate some income.
I mentioned Python because I think it can be used to analyze the entire database for anomalies strange behavior of some players, and so on.
By the way, are you a representative of some poker site? Because you sound very legalistic. 1%, 10%... You really seem to understand these things. Haha.
 
Last edited:
MK_

MK_

Legend
Loyaler
Joined
Sep 14, 2022
Total posts
2,483
Chips
1,270
I mean the non showdown line is horrific...., besides the vpip the non showdown line is what stood out the most,

that's the playing style I was alluding to...., if the stats were clean and you had a large enough sample size then

you might be able to look for some anomalies but as it is I think looking at forces you can control

which is your own game is a far better use of time and energy, but you do you👍
 
Goggelheimer

Goggelheimer

Legend
Platinum Level
Joined
Feb 14, 2023
Total posts
1,322
Awards
3
Chips
792
Well this graph is nice but not really useful for tournaments.
This view is mostly more useful for cash game players (with constant 100 bb stacks).

The only thing in a cash game view is your red line (non showdown winning). It seems that you worked a bit on this.
But the always going down red line indicates normally that you don´t win enough with your bluffs (ending the hand before the river).
So your bluffs don’t seem to work, or you play too honest (bluffing too less).
But I admit that in today's mirco- and/or lowstakes tournaments way too many hands go to the showdown, imo.

Better use the DB review report to look where you have leaks (positional play, 3-betting, and so on).

This report can be found in the Download Warehouse -> Custom Reports see second screenshot.

Also take the normal tournament results view more serious where you can find these values ROI and ITM.
Hint if your green line (net won) is above the net adjusted and both are above the 0 line and they are climbing upwards all is fine.
These may help you much more than the redline and won BB/hand or BB/100, you can use them for primedope simulations.

With the ROI and the ABI (average Buy IN) you can check your results graph against the one (simulated) with the tournament variance calculator (primedope).

1756601330038 1756601577588
 
Last edited:
S

smashthemafia69

Rising Star
Bronze Level
Joined
Aug 29, 2025
Total posts
12
IE
Chips
40
Okay. I'm working on the red line and you can see it's starting to go up slightly over the last 30-40k hands. I'll keep working on it. I use DTO every day. I'm thinking next month to try GTO Wizard, because in DTO I can't review all my spots. It's mostly strong for play with stacks up to 40bb.
But the idea of my post wasn't really to look for leaks in my game. The point is, despite everything, this run seems unreal to me. I can't seem to smooth out the variance with such a volume.
 
primrose

primrose

Visionary
Bronze Level
Joined
Mar 29, 2024
Total posts
645
Chips
374
Okay. I'm working on the red line and you can see it's starting to go up slightly over the last 30-40k hands. I'll keep working on it. I use DTO every day. I'm thinking next month to try GTO Wizard, because in DTO I can't review all my spots. It's mostly strong for play with stacks up to 40bb.
But the idea of my post wasn't really to look for leaks in my game. The point is, despite everything, this run seems unreal to me. I can't seem to smooth out the variance with such a volume.
So you still haven't answered the question: what size of MTTs do you play?

By the way, are you a representative of some poker site? Because you sound very legalistic. 1%, 10%... You really seem to understand these things. Haha.
Hah, no, I just have a math-drilled brain from
 
F

fundiver199

Legend
Loyaler
Joined
Jun 3, 2019
Total posts
15,593
Awards
2
Chips
824
It would be usefull, if you would share your username on PokerStars and also make sure, you have opted in to sharkscope, so we can check your actual playing history and results. As others have said graphs like this are really only usefull for cash games and maybe for SnGs, but not at all for large field MTTs, where most of the money is won or lost in a few hands at final tables.

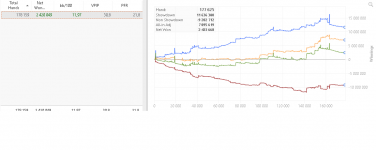
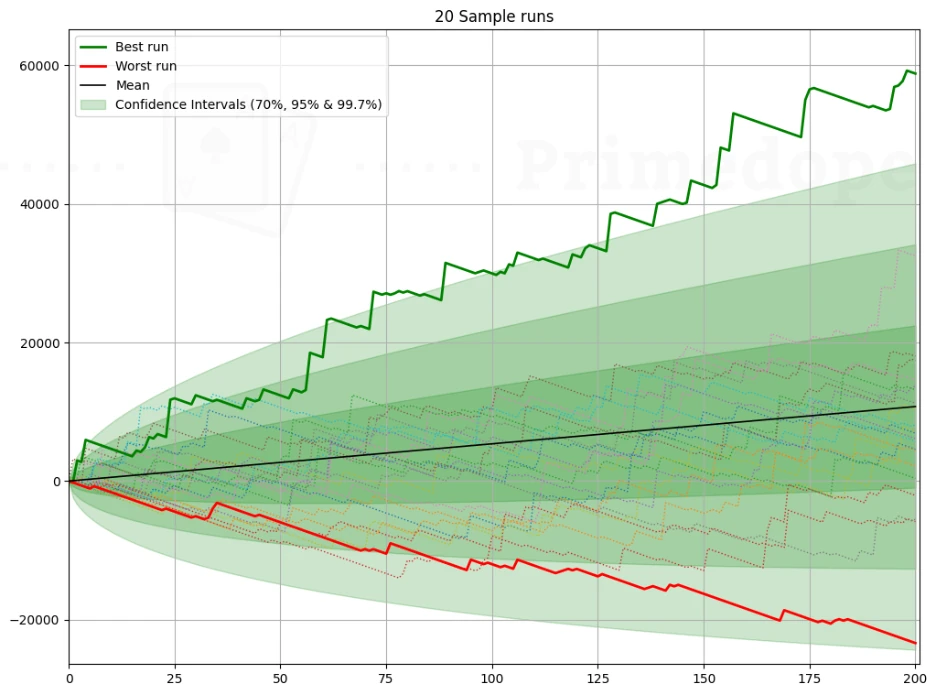
Your total sample is 178k hands, which is probably less than 2.000 MTTs assuming an average of 100 hands played in each. And the simple fact is, that there is massive variance over such a sample, especially if you play during peak hours, where fields on PokerStars are large. For instance with a field size of 1.000 players, 150 places paying and a ROI of 10%, there is 34% risk of losing after 2.000 games.


So most likely the main issue here is, that you dont understand the magnitude of variance in the game format, you have chosen to play. You feel, that your efforts "should" be rewarded by now, but the truth is, you have still not played enough to overcome variance. If you find this frustrating, then the solution is to change to a lower variance game. On PokerStars the best options for bankroll building are regular cash games (not Zoom) or On Demand SnGs with up to 18 or 45 players.

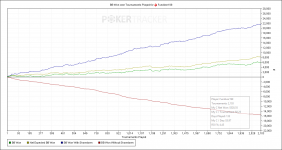
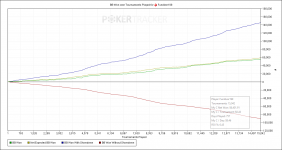
Finally its seems like, you are very focused on the difference between your actual results (in chips won) and the all-in adjusted results. This is a trap, people often fall into, and then they feel, they have been unlucky, if they run below all-in adjusted EV. But the result of all-in before the river pots is only part of variance. So its entirely possible to run below all-in adjusted EV and still have been lucky overall.

Maybe you ran AA into KK more often than the opposite, maybe you completed your draws more often, than you should, maybe you flopped to many sets and so on and so forth. Also we cant change, how we run, when we are all-in with AK vs. JJ, so honestly its best to completely forget this all-in adjusted EV number especially in tournaments.

In cash games all-in adjusted EV can be a tad more usefull as a slightly less inaccurate metric for your actual performance. Plus on PokerStars you can choose to cash out and eliminate this part of variance entirely at a fee. But of course thats not possible in tournaments, because the goal of a tournament is to bust everyone, until a winner is found.
 
Goggelheimer

Goggelheimer

Legend
Platinum Level
Joined
Feb 14, 2023
Total posts
1,322
Awards
3
Chips
792
Okay. I'm working on the red line and you can see it's starting to go up slightly over the last 30-40k hands. I'll keep working on it. I use DTO every day. I'm thinking next month to try GTO Wizard, because in DTO I can't review all my spots. It's mostly strong for play with stacks up to 40bb.
But the idea of my post wasn't really to look for leaks in my game. The point is, despite everything, this run seems unreal to me. I can't seem to smooth out the variance with such a volume.
Don´t overdo GTO play!

Most plays in micro- and low-stakes tournaments should be more exploitative (use your HUD to see exploitative tendencies,
if you have a big enough sample size on the players). Can be made if you play the same Sit and Go tournaments regularly.
The player pool is relatively smaller, filed sizes are not endless big (500+ players makes variance much bigger),
you can get usable HUD stats much faster.

You mentioned that this graph is from PokerStars only.
The games at PokerStars are not the softest games that exist.
The player pool there(PokerStars is much longer on the market than e.g., GG Poker) is relatively Reg heavy,
what means your edge is much smaller there than in other online poker rooms.
Your overall BB/100 is positive (green) this is great.
Sample size (number of hands) is significant, but to see trends, keep yourself playing more than a million hands.
Then you will see trends more clearly.

Always think in massive sample sizes and long-term sample sizes in online poker.

And as primrose said: you give far too less information (Buy In, field size) about the games you are playing to give a solid “mathematical” estimation.
It looks like you have a mathematical/statistical feeling (rigged or not).
 
Last edited:
Rosylly

Rosylly

Rock Star
Platinum Level
Joined
Jan 1, 2024
Total posts
208
UA
Chips
181
Yep, the difference between orange and green is brutal, u were very unlucky, but it's only 180k hands, it's not that much for MTTs, u should stay calm and patient.

What's your typical poker session looks like? How many tables and tournaments?
 
S

smashthemafia69

Rising Star
Bronze Level
Joined
Aug 29, 2025
Total posts
12
IE
Chips
40
Normally I play ABI 5–16. Two months ago I started a bankroll challenge with $100. You can find me in sharkscoope. Acebero63
 
Goggelheimer

Goggelheimer

Legend
Platinum Level
Joined
Feb 14, 2023
Total posts
1,322
Awards
3
Chips
792
I tend to block my results on sharkscope(opt out).
No one (players, tax office, police and so on) shall see data that gives information about my performance, except the players with me at the table and does use a HUD for his use.
 
F

fundiver199

Legend
Loyaler
Joined
Jun 3, 2019
Total posts
15,593
Awards
2
Chips
824
Normally I play ABI 5–16. Two months ago I started a bankroll challenge with $100. You can find me in sharkscoope. Acebero63
First of all you are actually winning with a total profit of $804 and a total ROI of 3,9%. The latter number could be higher of course, but at least your winning. Its understandable, if you feel like, its not been worth the time, you have invested, but since you are currently playing a lot of $1-$3 games, then at some point you have likely withdrawn winnings. And while there can be lots of good reasons for this (I am in the same situation myself), this will obviously make it difficult to move up.

Looking at your last 200 games played (a feature for subscribers) I can see, that you are playing a lot of $1-2 single table SnGs, which on PokerStars are very highly raked. So I would suggest to stop playing these games and focus on MTT and On Demand SnGs instead, and perhaps also slow down a bit. Nearly half your 4.800 games were played during the summer of 2025, which is almost 30 games per day.

This is by no means a record, but it can still lead to burn-out, especially if you also have a regular job to take care of and is not finding enjoyment in the daily grind. At least your graph is pointing solidly upwards for the past 1.500 games, so maybe you just need a break and perhaps reconsider your game selection a little bit, so you dont pay more rake, than you need to. And then of course stop withdrawing, so that you can finally move out of the micros.
 
S

smashthemafia69

Rising Star
Bronze Level
Joined
Aug 29, 2025
Total posts
12
IE
Chips
40
I don’t see any point in moving up until I start running closer to expectation. If online poker keeps putting me below EV, then once I bust, I’ll just quit. In that case, I’ll focus on finding a way to prove something isn’t right with the variance I’m experiencing. Considering the size of the player field , it feels ridiculous endless runner-runners, gutshots hitting, setups, coolers… just constant punishment. I don’t see any reason to move up unless I can consistently beat the games with something like a 50% ROI, which I believe is fair. If I actually find anomalies, I’ll even go public with it, maybe even through TV.
 
primrose

primrose

Visionary
Bronze Level
Joined
Mar 29, 2024
Total posts
645
Chips
374
50% ROI is totally bonkers, that's what I get in ultra soft live tournaments. No way you can get that in online poker. 10% ROI would be excellent.

I don't understand how the sudden drops in the graph can come from sit and gos though. How could they play for so many chips at once?
 
F

fundiver199

Legend
Loyaler
Joined
Jun 3, 2019
Total posts
15,593
Awards
2
Chips
824
I don’t see any point in moving up until I start running closer to expectation.
You are focusing on a completely meaningless number, which as I already explained is only a small part of the overall variance in poker. And you are solidly up over the last 1.500 games, so chances are, that at least over this sample you have been running hot rather than cold. If you still really insist of focusing on that meaningless all-in adjusted graph, then at least make it show BB rather than chips, which PT4 can also do. In that way it become much more standardized, so that a hand at the final table in an MTT with 30.000 starting chips dont count 100 times as much as a SnG hand with 1.500 starting chips.
If online poker keeps putting me below EV, then once I bust, I’ll just quit.
This victim mentality is your worst enemy. There is no evidence, that you have been treated "unfair", or even that you have been unlucky overall. Its just something, you have gotten on your brain, and which prevent you from focusing on things, that actually matter.
In that case, I’ll focus on finding a way to prove something isn’t right with the variance I’m experiencing.
Good luck with that.
Considering the size of the player field , it feels ridiculous endless runner-runners, gutshots hitting, setups, coolers… just constant punishment.
Classic tilt. The cure is to take a break, and when you come back only play, when you enjoy it.
I don’t see any reason to move up unless I can consistently beat the games with something like a 50% ROI, which I believe is fair.
Regardless what you believe is "fair", hardly any players can achieve such numbers. This is the player topping the SnG leaderboard on PokerStars for 2025. His total ROI is around 9%.

If I actually find anomalies, I’ll even go public with it, maybe even through TV.
Once again you are wasting your time.
 
primrose

primrose

Visionary
Bronze Level
Joined
Mar 29, 2024
Total posts
645
Chips
374
I'd really like to know how poorly OP is actually running in the EV thing. I thought it would be very unlikely with sit&gos but maybe my intuition is widely off and it's just bottom 20% or something
 
F

fundiver199

Legend
Loyaler
Joined
Jun 3, 2019
Total posts
15,593
Awards
2
Chips
824
I'd really like to know how poorly OP is actually running in the EV thing. I thought it would be very unlikely with sit&gos but maybe my intuition is widely off and it's just bottom 20% or something
I think, we need the graph in BB rather than chips to even draw any conclusions. Then I am sure, some statistical analysis can be performed, as 1.000`s of players using trackers have likely already done ;)
 
F

fundiver199

Legend
Loyaler
Joined
Jun 3, 2019
Total posts
15,593
Awards
2
Chips
824
This is my graph for PokerStars 2025. A somewhat significant gap of around 2.000 BB between actual results and all-in adjusted results over 2.000 games. In a cash game this would mean running 20 BIs below all-in adjusted EV or $200 at 10NL.
 

Attachments

  • BB Won over Tournaments Played for (PokerStars) Fundiver199 2025.png
    BB Won over Tournaments Played for (PokerStars) Fundiver199 2025.png
    67.2 KB · Views: 8
Last edited:
F

fundiver199

Legend
Loyaler
Joined
Jun 3, 2019
Total posts
15,593
Awards
2
Chips
824
However in my total database, which cover my last 15.000 games, the difference is insignificant.
 

Attachments

  • BB Won over Tournaments Played for (PokerStars) Fundiver199.png
    BB Won over Tournaments Played for (PokerStars) Fundiver199.png
    57.2 KB · Views: 16
Top